Campus Tour Operations System
Live coordination dashboard for tour groups moving between stations, built on Google Apps Script and Google Sheets at zero monthly cost.
Campus Tour Operations System
Campus tour days were coordinated by walkie-talkie and clipboard. Nobody had a single view of where each group was, which station was backed up, or which group had stopped moving — problems surfaced only after a group was already late.
- Sheets API calls removed per interaction
- 3+
- Monthly running cost
- ฿0
- Google Apps Script
- Google Sheets
- HTML Service
How it works
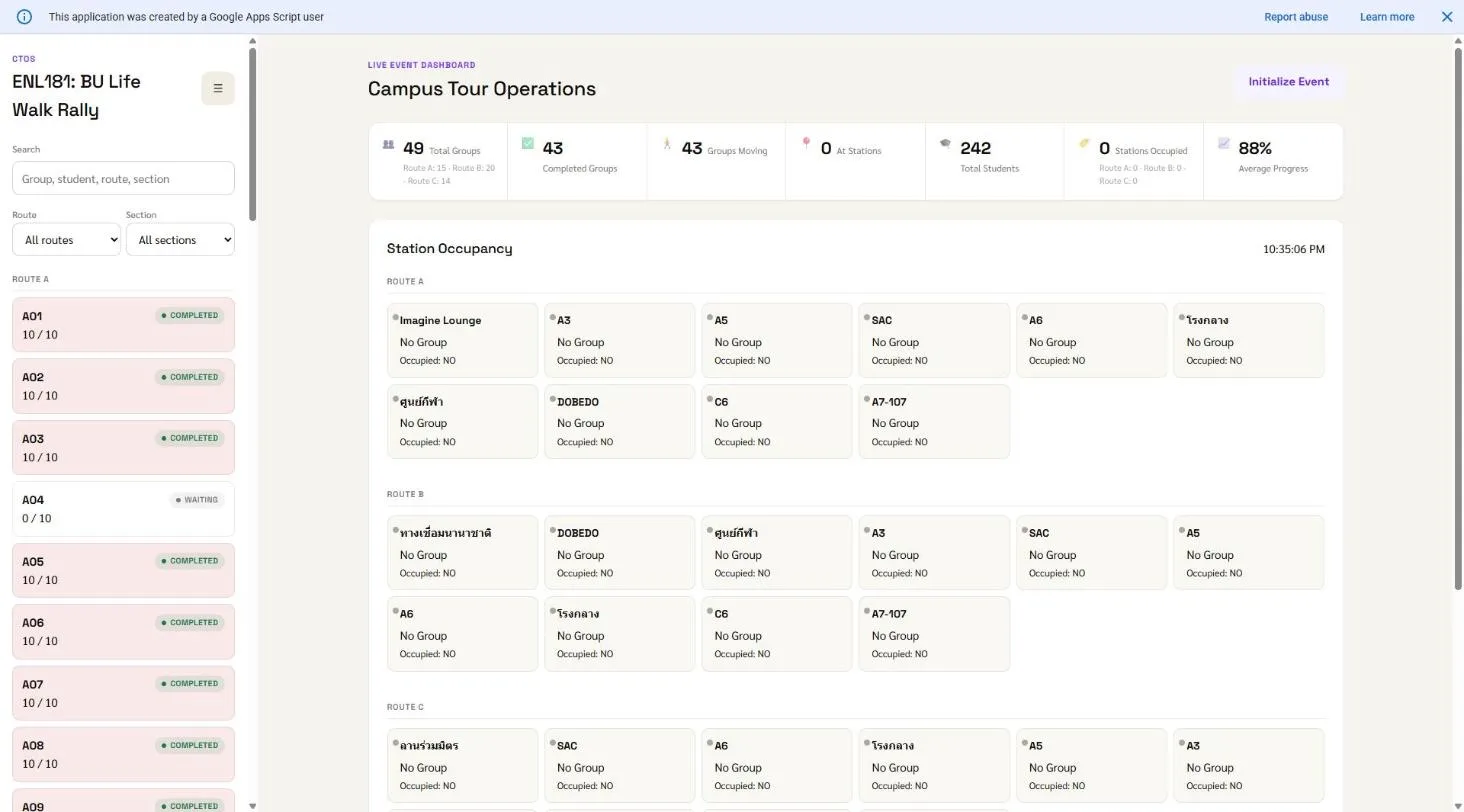
Every tour group is a row. It carries a route, a section, a head count, the station it is currently at, and a status — moving, arrived, or completed. Staff at each station mark a group in and out from their phone; the dashboard adds it up live: total students on site, how many groups are between stations right now, how many have finished, and the state of every station.
The sheets behind it are deliberately boring — Settings, Groups, Students,
EventLog, StationStatus. Anyone on the committee can open the spreadsheet
and read it without me there to explain, which matters more than elegance for a
tool that has to survive me graduating.
The part I am most pleased with
Groups do not report that they are stuck. They just stop moving, and nobody notices until a downstream station is standing idle.
So the system computes how long it has been since each group was last updated and surfaces anything that has gone quiet. It is a small piece of arithmetic that turns the dashboard from a record of what happened into a warning about what is about to.
Measuring before optimising
The first version rewrote the station-status sheet and read it back on every single interaction — three or more Sheets API calls per click, for a value only the client ever consumed and the sheet was never read back for. On a quiet afternoon that was invisible. During an actual event, with staff at every station tapping at once, it was the difference between instant and sluggish.
Computing it in memory and returning it directly removed those calls. That change came from watching the tool be slow while people were using it, not from guessing in advance — and I would not have predicted which call was the expensive one.
There is a second, subtler fix in the same place: dates have to be serialised
before they cross back to the client, because a raw Date in an Apps Script
return value breaks the JSON encoding for the entire response, not just that
field. One unserialised timestamp takes the whole dashboard down.
Live Dashboard
Every group, every station, on one screen — colour-coded by progress so a stuck group is visible in seconds instead of surfacing as a complaint twenty minutes later. Staff at each station mark a group arrived or departed from their own phone, and the dashboard reflects it for everyone else within the next refresh, replacing a system where the only way to know where a group actually was involved radioing someone and waiting for them to look. A route filter and a search box let a coordinator narrow forty-nine simultaneous groups down to the one they are actually asking about, rather than scanning a full board by eye during a live event.
The Data (Google Sheet)
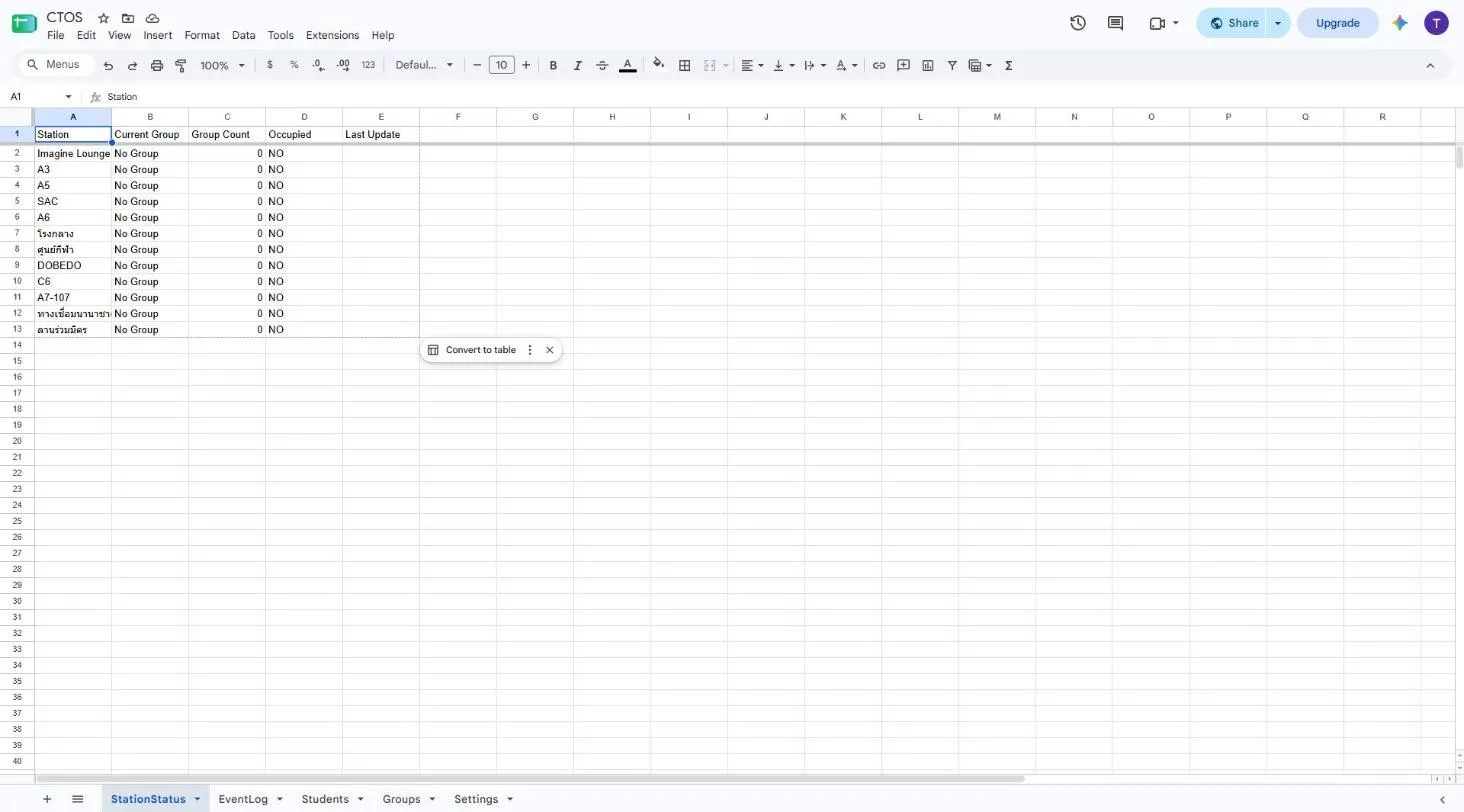
The entire backend is a spreadsheet — one row per station, updated live as staff mark groups in and out from their phones. No database to provision, no hosting to pay for, and whoever inherits this after graduation can open the sheet directly and understand exactly what it is tracking without reading a schema document first. The dashboard polls this sheet rather than holding its own state, so the sheet is never out of sync with what staff see — there is only one source of truth, and it is the one everyone already knows how to open.
The Code (Apps Script)
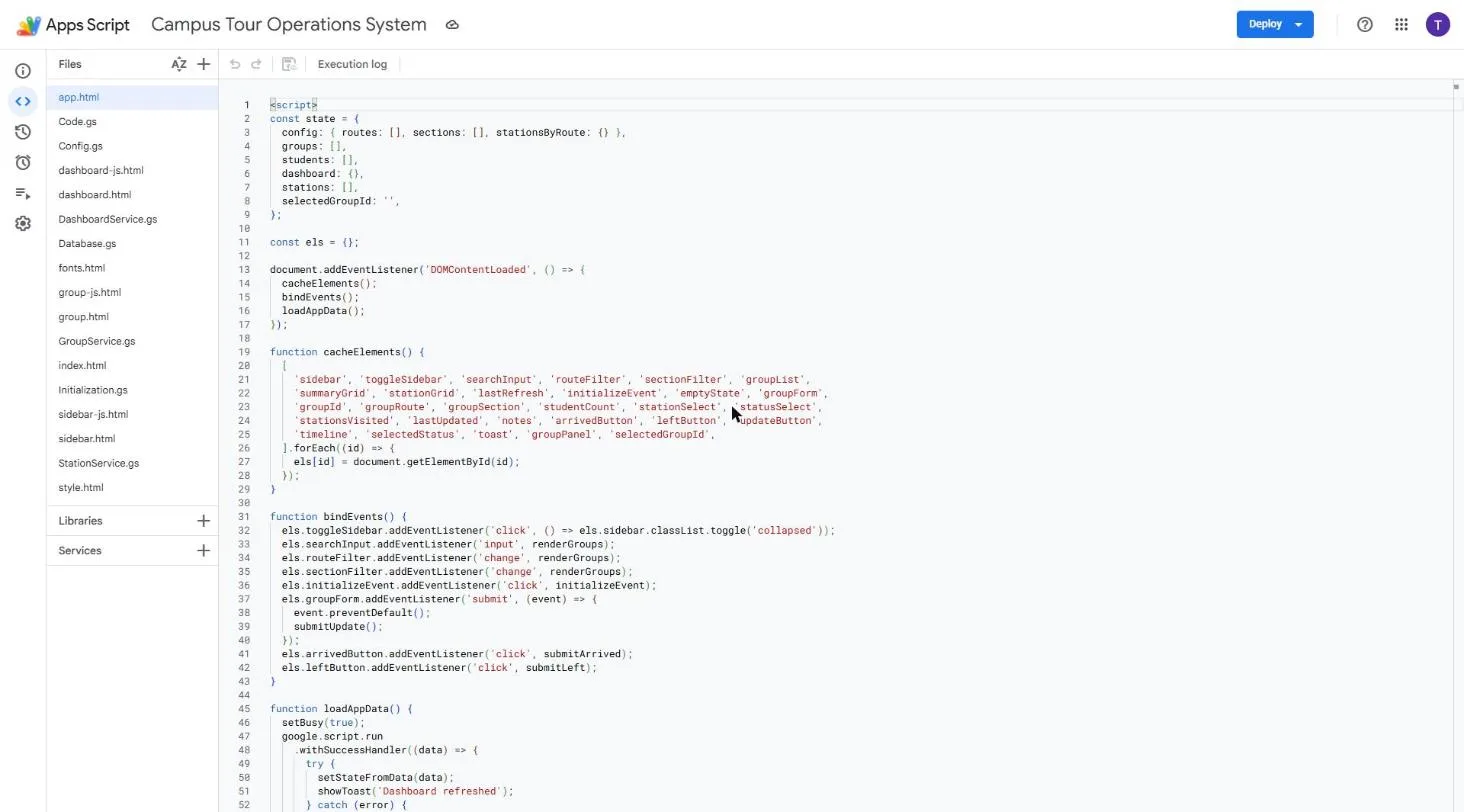
Client-side state management in plain HTML Service — no framework, because the whole app is one page. A small hand-written state object, a render function that re-draws from it, and calls back to the Sheet through google.script.run to fetch or mutate the underlying data. The Sheets API call actually worth removing turned out not to be the one that looked expensive at a glance — measuring where time went mattered more than guessing, a lesson that carried straight into the later portal rebuild.